
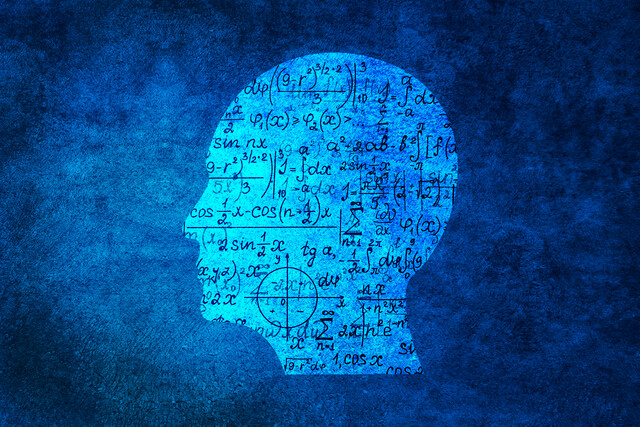
Online Class: Statistics 101

no certificate
with CEU Certificate*
-
15Lessons
-
31Exams &
Assignments -
4,839Students
have taken this course -
35Hours
average time -
3.5CEUs
Course Description
This statistics course introduces the basic concepts of statistical analysis, with a focus on both univariate (single-variable) and bivariate (two-variable) data. The course starts with an introduction to statistics terms and then moves on to organization and display of data. Analysis of univariate data by way of measures of central tendency (such as the mean or average), dispersion (such as the variance), and asymmetry ("skewness") is presented next, followed by an introduction to probability theory.
The relationship of probability to statistics is also discussed, providing students with the tools they need to understand how "chance" plays a role in statistical analysis. Statistical distributions, with a focus on the normal distribution and its uses, are also considered, along with a discussion of bivariate data and linear (least-squares) regression. Finally, the course culminates with a low-level introduction to hypothesis testing. Although this last topic could be a course of its own, the student is provided with enough theory and sufficient practice to conduct analyses of simple statistical hypotheses.
Statistics is a subject that has earned a certain amount of notoriety because of its misuse in various contexts. Nevertheless, statistics is a tool that, if used properly, can be of tremendous help in math, science, engineering, history, politics, and numerous other fields. As you study this subject, always keep in mind that statistics is more than just math: it is not simply manipulation of numbers through addition, subtraction, multiplication, division, and other mathematical operations. Statistics also involves language and units: when a statistician (or layman) provides a statistic, it involves a number and a label of some sort. For instance, the number 5.3 is not in and of itself a statistical value; "an average age of 5.3 years," however, is a statistical value. This linguistic aspect of statistics sometimes allows a certain amount of ambiguity that can be misleading. By studying statistics, you will equip yourself to identify and understand both uses and abuses of this tool.
What is Statistics?
Statistics is used for quantifying sets of data such as attributes of a group of people and measurements taken in a laboratory. Consider, for instance, the population of a particular country. The people who reside in that country have varying heights: some are short, some are tall, some are in between. If we wanted to compare the height of this population with that of some other population in a convenient manner, we would not want to compare individual people. Such a task would be burdensome (the number of people in a country might be in the millions or billions) and would not necessarily be particularly helpful as a means of comparing populations as a whole. Instead, we can use an average or median height as the basis for our comparison. These statistical values are single numbers that quantify the data (the heights of a country's population) and that provide a convenient way to express and compare certain characteristics of those data. Part of the goal of this course is to teach you how to select and use statistical tools like averages and medians, as well as a host of others, in assessing and comparing data.
Simply defined, statistics (sometimes colloquially termed "stats") is the study of collecting, analyzing, interpreting, and representing of sets of numerical data. Thus, virtually any field of study that uses numbers can, at least occasionally, involve statistics. Statistics, because it makes extensive use of numbers, is math-intensive, and a decent grasp of basic arithmetic and algebra is required to study this field.

- Completely Online
- Self-Paced
- 6 Months to Complete
- 24/7 Availability
- Start Anytime
- PC & Mac Compatible
- Android & iOS Friendly
- Accredited CEUs

Course Lessons


Lesson 1. Unveiling the World of Statistics: A Gateway to Understanding and Application
Statistics is a versatile tool that aids in compiling, interpreting, and applying numerical data across multiple disciplines. This overview establishes the groundwork by introducing key statistical concepts and the importance of differentiating between population and sample data.Lesson 2. Data Organization and Visualization: Building Tables and Graphs
Organizing data for statistical analysis is crucial for efficient calculations and inference; this lesson covers constructing tables and understanding graphical data presentations. Emphasizing terms like frequency, cumulative frequency, and relative frequency, it guides their application through examples.Lesson 3. Measuring the Center: Understanding Mean, Median, and Mode
Measures of central tendency, including the mean, median, and mode, describe the 'center' of a dataset, each uniquely suited to different data distributions. This lesson emphasizes that while the mean is popular, skewed distributions may require the median or mode for accurate representations.Lesson 4. Choosing Your Measures: Understanding Central Tendency
This lesson teaches how data set nuances can make selecting the right measure of central tendency a non-trivial task. By illustrating with examples, it discusses the balance between the mean, median, and mode, and the importance of context to avoid misleading interpretations.Lesson 5. Characterizing the Spread: A Guide to Variance and Standard Deviation
This lesson on measures of dispersion explains variance and standard deviation as tools to gauge data spread around a mean. It distinguishes between broad population analyses and specific sample estimates, with adjustments for freedom degrees to improve accuracy.Lesson 6. The Role of Skewness in Statistical Analysis
This lesson delves into skewness, a statistical measure that explains the asymmetry of a data set, enriching our understanding beyond just central tendency and dispersion. By quantifying skewness, we can determine both the degree and direction of data asymmetry relative to the mean.Lesson 7. Understand Percentiles and Quartiles
The lesson explores statistical measures like percentiles and quartiles, which help describe data set positions. Understanding these concepts enhances data interpretation beyond just central tendency and dispersion.Lesson 8. Understanding Probability: The Backbone of Statistical Analysis
The connection between chance events in experiments and statistics highlights the importance of terms like outcome, event, sample space, and random variable in probability theory. Using statistical measures like mean and standard deviation helps in comprehending and describing these random variations.Lesson 9. Counting Outcomes for Probability
This lesson delves into solving probability problems by counting the outcomes of random experiments, utilizing key concepts such as permutations and combinations. By understanding the influence of replacement and ordering, one can effectively calculate probabilities by determining relative frequencies.Lesson 10. Fundamentals of Discrete and Continuous Distributions
This lesson blends statistics and probability to explore statistical distributions, highlighting the distinction between discrete and continuous types, and showing how to calculate mean and standard deviation. With practice problems, it demonstrates practical applications like rolling a die or estimating measurement expectations.Lesson 11. Normal Distribution and Z-Scores
This lesson deciphers the normal distribution and its statistical applications, emphasizing how to use Z-scores for standardizing data to estimate probabilities with ease. Probabilities are often computed using tables, which provide a user-friendly method to navigate complex probability calculations.Lesson 12. Exploring Bivariate Data Distributions: A Foundation for Advanced Statistical Concepts
By transitioning from univariate to bivariate data analyses, the lesson underscores the importance of scatterplots and marginal distributions, equipping learners to evaluate statistical dependencies. It serves as groundwork for exploring how random variable interactions inform advanced statistical methods like regression.Lesson 13. Introduction to Least-Squares Regression
This lesson delves into least-squares linear regression, discussing its formulation and the correlation measure for bivariate data. It offers a robust algebraic approach to fitting linear trends to datasets while addressing the 'goodness of fit.'Lesson 14. Crunch Time: Hypothesis Testing in Practice
Through understanding hypothesis testing, students will grasp concepts like null and alternative hypotheses, significance levels, and test statistics. The lesson applies these principles to real-world scenarios, enhancing analytical skills and decision-making capabilities.Lesson 15. Significance Levels and Error Analysis in Hypothesis Testing
By focusing on error types in hypothesis testing, the lesson underscores the critical nature of choosing an appropriate significance level, influencing the probability of errors like Type I or Type II. Practice questions enable students to apply these concepts and strengthen their analytical skills.
Learning Outcomes
- Explain the importance of statistics in various fields and identify examples of its misuse for improved decision-making skills
- Recognize and define key statistical terms such as univariate data, bivariate data, and population by the end of the lesson
- Demonstrate the ability to discern between discrete and continuous data sets and select appropriate graphical methods for their representation.
- Recognize and construct frequency tables, relative frequency tables, and cumulative frequency tables to organize discrete data sets.
- Define and calculate the mean, median, and mode for a given data set.
- Demonstrate the ability to select the appropriate measure of central tendency for non-symmetrical data distributions.
- Demonstrate the ability to select the appropriate measure of central tendency based on data distribution and context.
- Identify potential biases and ambiguity when presenting statistical data using different measures of central tendency.
- Calculate the standard deviation of a given data set, distinguishing between population and sample data to apply appropriate formulas.
- Identify the differences between population and sample variance calculations, emphasizing the use of degrees of freedom for sample data.
- Calculate the skewness of a given data set, determining its directionality and impact on the distribution compared to measures of central tendency and dispersion.
- Recognize and define skewness as a measure of asymmetry in a data distribution, identifying its role in quantifying data skew in either direction.
- Define and calculate the range of a given data set to effectively measure data dispersion.
- Demonstrate mastery of lesson content at levels of 70% or higher.
Additional Course Information

- Document Your Lifelong Learning Achievements
- Earn an Official Certificate Documenting Course Hours and CEUs
- Verify Your Certificate with a Unique Serial Number Online
- View and Share Your Certificate Online or Download/Print as PDF
- Display Your Certificate on Your Resume and Promote Your Achievements Using Social Media

Choose Your Subscription Plan
No Certificate / No CEUs
This course only
| Includes certificate | X |
| Includes CEUs | X |
| Self-paced |

|
| Instructor support |
|
| Time to complete | 6 months |
| No. of courses | 1 course |
Certificate & CEUs
This course only
| Includes certificate |
|
| Includes CEUs |
|
| Self-paced |
|
| Instructor support |
|
| Time to complete | 6 months |
| No. of courses | 1 course |
Certificates & CEUs
Includes all 600+ courses
| Includes certificate |
|
| Includes CEUs |
|
| Self-paced |
|
| Instructor support |
|
| Time to complete | 12 Months |
| No. of courses | 600+ |
Certificates & CEUs
Includes all 600+ courses
| Includes certificate |
|
| Includes CEUs |
|
| Self-paced |
|
| Instructor support |
|
| Time to complete | 24 Months |
| No. of courses | 600+ |
Student Testimonials
- "Great timely feedback!" -- Audrey K.
- "I found that the course resources helpful. I needed it especially for the lesson on normal distriuubtion. I needed to refer to it for the z-scores." -- Tiffany L.
- "I found the course very interesting and the instructor was very helpful. Well organized chapters and the practice problems." -- Gayatri M.
- "I found all the parts to be helpful." -- Nancy G.
- "My course instructor was very prompt in providing feedback and responding to emails and tried to clarify concepts that I had questions on." -- Kimberlly S.
- "I like that the course was organized well." -- Kimberlly S.
- "Very knowledgeable and helpful instructor. This course set-up is much more user friendly than other statistics refreshers I have tried." -- Julie R.
- "The lessons are laid out very nicely. They tell you what you need to now for the most part. My instructor answered questions promptly and with detail." -- Julie R.
- "The instructor is wonderful. I would have him as an instructor again." -- Cynthia M.
- "The Instructor was very pleasant, offering words of encouragement when I did poorly on the second exam. He was fairly prompt with grading assignments and answering emails. I would recommend him for this class in the future." -- Jessica S.
Related Courses
-
 14 hours
1.4 CEUs
QuickBooks 101
+ More Info
14 hours
1.4 CEUs
QuickBooks 101
+ More Info
-
 10 hours
1.0 CEUs
Autism 101
+ More Info
10 hours
1.0 CEUs
Autism 101
+ More Info
-
 9 hours
0.9 CEUs
Relaxation 101
+ More Info
9 hours
0.9 CEUs
Relaxation 101
+ More Info
-
 12 hours
1.2 CEUs
Office Skills 101
+ More Info
12 hours
1.2 CEUs
Office Skills 101
+ More Info
-
 21 hours
2.1 CEUs
Applied Statistics 101
+ More Info
21 hours
2.1 CEUs
Applied Statistics 101
+ More Info
-
 9 hours
0.9 CEUs
Marketing 101
+ More Info
9 hours
0.9 CEUs
Marketing 101
+ More Info
-
 11 hours
1.1 CEUs
Mediation 101
+ More Info
11 hours
1.1 CEUs
Mediation 101
+ More Info
-
 7 hours
0.7 CEUs
Nutrition 101
+ More Info
7 hours
0.7 CEUs
Nutrition 101
+ More Info
-
 3 hours
0.3 CEUs
Etiquette 101
+ More Info
3 hours
0.3 CEUs
Etiquette 101
+ More Info
-
 16 hours
1.6 CEUs
Psychology 101
+ More Info
16 hours
1.6 CEUs
Psychology 101
+ More Info
-
 6 hours
0.6 CEUs
Cybersecurity 101
+ More Info
6 hours
0.6 CEUs
Cybersecurity 101
+ More Info
-
 5 hours
0.5 CEUs
Astrology 101
+ More Info
5 hours
0.5 CEUs
Astrology 101
+ More Info
-
 9 hours
0.9 CEUs
Aromatherapy 101
+ More Info
9 hours
0.9 CEUs
Aromatherapy 101
+ More Info
-
 7 hours
0.7 CEUs
Numerology 101
+ More Info
7 hours
0.7 CEUs
Numerology 101
+ More Info